Evaluation of DEKALB® Brand Corn Products to Planting Rates
November 15, 2022
TRIAL OBJECTIVE
- Planting rates are a key decision for maximizing product yield potential. Understanding how a product responds to planting rates is a critical component of the decision-making process.
- This trial was conducted to evaluate the response of DEKALB® Brand corn products to planting rates.
- Questions include -
- Which DEKALB® brand products provide the highest potential return on investment for increasing seeding rates?
- Which planting rate or ranges of rates optimize the potential performance of a DEKALB® brand product at Scott, MS?
- Knowing the appropriate planting rate and the associated potential net return is important for agronomic and financial planning.
- Product performance based on planting rate is useful when ordering DEKALB® corn products for planting in 2023.
RESEARCH SITE DETAILS
- All agronomic inputs were applied per local standards.
- Planted on bedded 38-inch rows.
- Single row planting.
- 265 lbs N per acre as liquid - surface application.
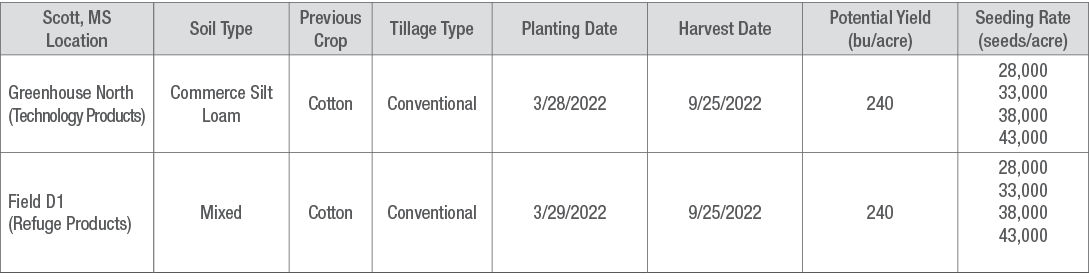
- Planting rates were 28,000, 33,000, 38,000, and 43,000 seeds/acre
- Single replication strip plot
- Greenhouse North: 6 rows x 140 feet long (0.061 acres/plot)
- Field D1: 12 rows x 100 feet long (0.87 acres/plot)
- Plots planted and harvested with commercial equipment.
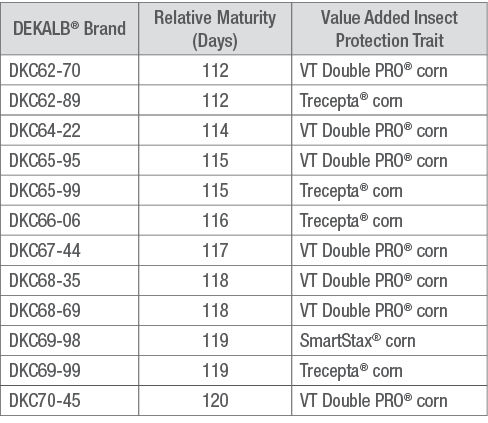
- DEKALB® brand insect protected products planted at Greenhouse North Location (Table 1).
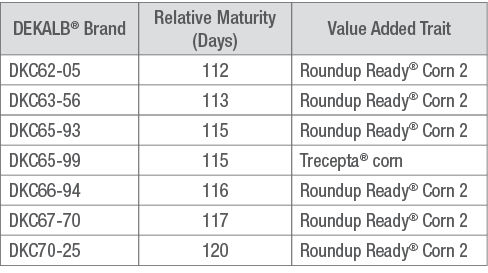
- DEKALB® brand refuge products planted at Field D1 location (Table 2).
- Analysis
- Yields
- Entire plots harvested – 6 (Greenhouse North) or 12 (Field D1) rows.
- Return on Investment calculations (all future references to “return on investment” in this article use this calculation).
- All yields (bu/acre) corrected to 15.5% moisture content.
- Seed cost – Assumed to be -
- Technology Products – $ 5.00/1000 kernels
- Refuge Products – $4.25/1000 kernels
- Grain Price – August 2023 delivery (2023 used for future budgeting and planning)
- $6.36/bu @ 15.5% moisture content
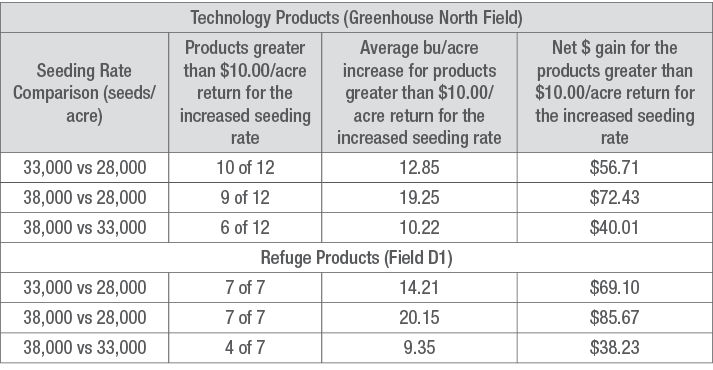
- For each comparison, products with less than $10.00/acre return excluded from calculations.
- Yields
UNDERSTANDING THE RESULTS
- The germination and plant establishment for each planting rate was approximately 92%.
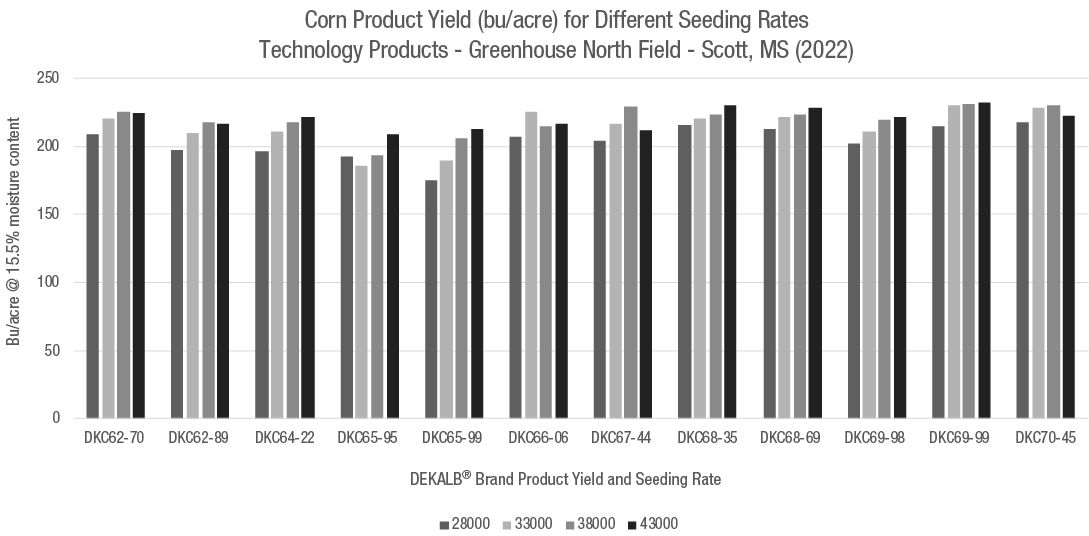
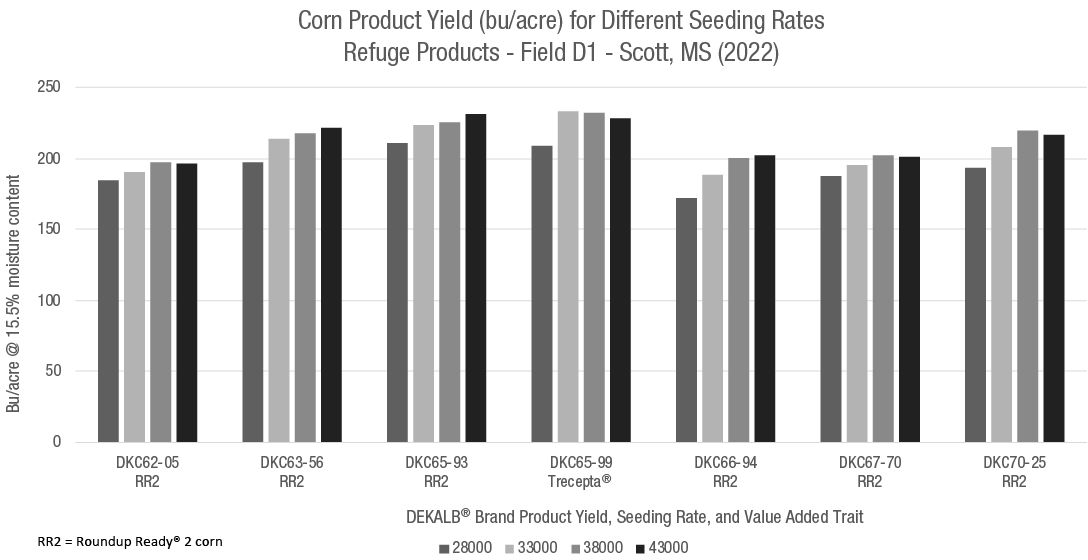
- Typical yield responses were observed in this data (Figures 1 and 2).
- Products with less than $10.00/acre return were excluded from calculations.
- Observations (Table 3 and Figures 1 and 2):
KEY LEARNINGS
- Growers should carefully evaluate the response of individual corn products to seeding rates for three factors:
- If seeding rates are increased, do yields increase?
- Will my chosen product respond to seeding rates?
- Will products maintain adequate standability with increasing seeding rates?
- Return on Investment estimates can range among products. For the tested products, the range was from -$89.00/acre to $149.00/acre depending on the comparison.
- This type of data helps growers determine planting parameters prior to seed purchase and planting season.
1220_64706